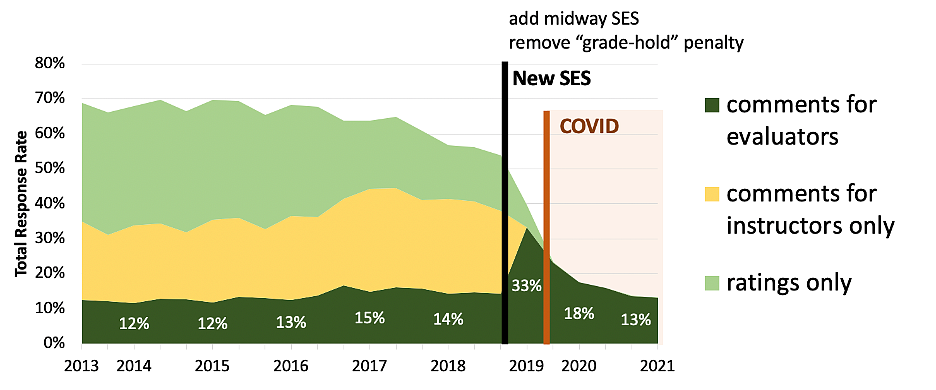
Course survey response rates have been declining slowly since at least 2015. The launch of the redesigned SES coincided with other changes to course surveys that likely impacted response rates including removing the negative incentive of the “grade-hold” penalty and the addition of a mid-way survey that effectively doubled the number of surveys each student is asked to complete each term. After the launch of the SES, we only had a single term before COVID began.
Another coinciding change was a re-interpretation of Oregon state law, that used to require students to “sign” their comments in order for them to be included in evaluation materials. In the old survey, while around 65% of students completed the ratings, only 35% wrote any comments, and only 12-15% signed comments. In the new SES, the ability to sign comments is removed and all comments are available to both the instructor and evaluators. Therefore, even with the declining response rates, the number of comments for evaluators has slightly increased, even with the decline in overall response rates. Effectively, the response rate decline represents a removal of student responses that only provided numeric ratings and of comments that were only available to the instructor.
SES response rates by course type or modality
Student surveys are sent for all instructors of every course section, including labs and discussion sections. Overall, response rates are the highest for lecture sections (22.3%), and are slightly reduced in lab (16.7%) and discussion sections (17.8%). Online sections of courses also reduce slightly lower response rates (17.9%).
Is the SES meeting its intended goals?
The redesigned end of course student experience surveys aimed to:
- Ensure student ratings are not a stand-alone proxy for teaching quality by removing quantitative ratings
- Ask targeted questions about specific teaching practices
- Automatically categorize comments by topic and sentiment, and
- Provide more feedback about teaching practices and less about irrelevant factors
The survey has removed numerical ratings from the teaching evaluation process. And new teaching evaluation reports organize student feedback by specific teaching practices and by UO's teaching excellence criteria. However, with current response rates, while evaluators receive the same amount of qualitative feedback, instructors themselves are receiving fewer comments from students.
The types of student feedback collected also seems to be different in the new student experience surveys. Early research projects indicated that the new SES was providing more teaching-related feedback and fewer comments about instructors personal characteristics. Specifically, personal comments were reduced from 21% to 1.5% of comments (comparing survey results from the same instructors before and after implementing the new surveys).
More recent analysis suggests that references to personality traits are reduced in the new SES. More detailed research is underway to better understand how student feedback has changed in the new surveys and to identify to what extent surveys are collecting biased responses based on instructor identity.