Instructor SES Dashboard
This page is a resource for instructors to access student feedback from end-of-course Student Experience Surveys (E-SES).
The interactive report linked below includes all E-SES responses for a single instructor. You can use the tabs (at the bottom) or buttons within the report to navigate between pages. Student comments about specific teaching practices are organized by UO teaching excellence categories (professional, inclusive, engaged, and research-informed).
The report below is designed to mirror the way evaluators are shown E-SES responses. Instructors can see redacted samples of these reports (Teaching Overview Report and Teaching Detail Report (SES)) or can request these reports from their department managers or department heads who have access through cognos.uoregon.edu.
**This dashboard is only viewable for instructors and each instructor only has access to their own student responses.**
Graduate Employees need to have their Microsoft 365 account upgraded in order to access this dashboard. Submit a request here to upgrade your account and access the Power BI Instructor SES Dashboard
Instructors can still access student feedback through Duckweb. Access instructions for finding student feedback here.
View your SES dashboard here:
Log in and Access your SES responses
Instructions for Navigating the dashboard:
Instructors will need to log in with their UO Microsoft account credentials to access their own SES data.
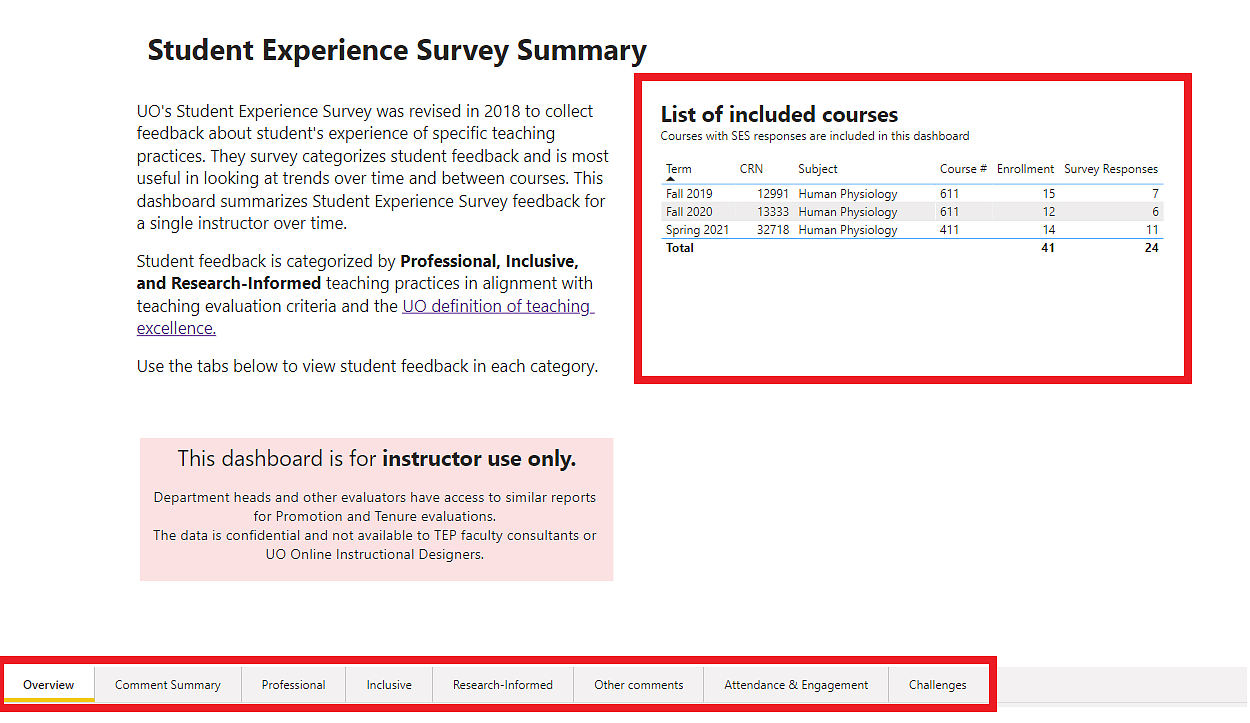
The Overview page shows a list of courses that have end-of-course Student Experience Surveys.
The tabs at the bottom of the page allow instructors to navigate between pages of the report.
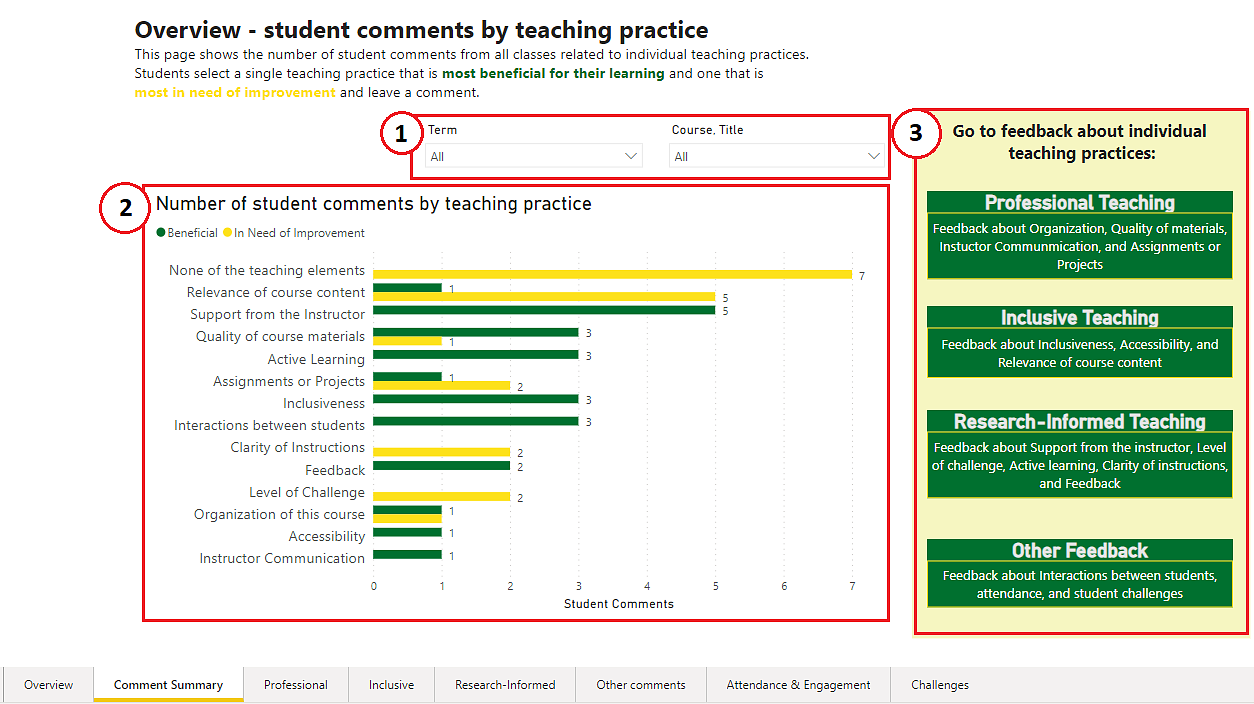
The Comment Summary page summarizes the number of comments an instructor has received related to any specific teaching practice included in the Student Experience Survey.
- Filters allow instructors to select specific academic terms and/or specific courses.
- The graph shows the number of student comments related to each teaching practice included in the student experience survey.
- Use these buttons to navigate to other pages that show specific student comments about each teaching practice, organized by UO's teaching excellence categories (professional, inclusive, and research-informed).
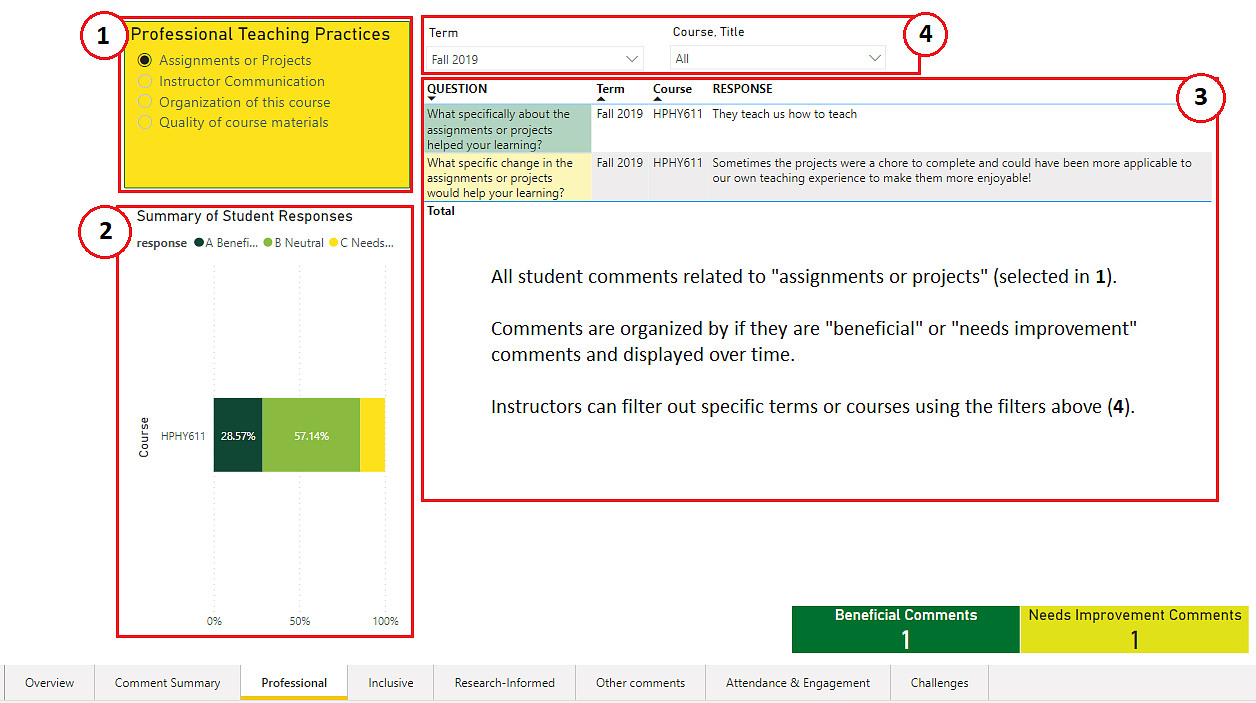
The Professional, Inclusive, and Research-Informed pages each summarize student ratings and comments about each specific teaching practice.
- Select different teaching practices related to UO's definition of professional teaching to display ratings (section 2) and comments (section 3) related to that teaching practice.
- Students respond indicating if each teaching practice was Beneficial, Neutral, or In need of Improvement to support their learning. Results for each course are shown in section 2 and can be filtered with the term and course filters in section 4.
- All student comments related to each teaching practice selected in section 1 are displayed. Comments are organized by whether they are "Beneficial" of "In Need of Improvement" and displayed over time to better show patterns of change over time.
- Filters allow instructors to select specific academic terms and/or specific courses.
Report an Issue, Request Access, or Provide Feedback
To help instructors use student feedback for improvements, we are working to summarize student responses to specific questions about teaching practices from the E-SES. These Practitioner Guides describe the common ways students describe each teaching practice and provide recommendations for instructors. Find all of the Academic Data Analytics Practitioner Guides on this page. Or read specific reports on Inclusiveness, Accessibility, or Support from the Instructor.